Analytics
Who can use this feature
Site Admin, Channel Admin
Supported features: Videos, Live Events, Advertising
Introduction
The Site Analytics feature lets you measure the popularity of your video and site. Analytics tracks and reports the web traffic on your uploaded videos and advertisements by providing comprehensive data such as the number of clicks, view time and number of plays.
Analytics overview video
Channel Analytics
Channel Analytics provide insight into the number of plays and the amount of time viewed for all video content on your platform.
Analytics is unique per channel for those of you who have the multi-channel feature.
Opening Channel Analytics
If you are on a single-channel platform, simply look for the Analytics tab under Channel Settings in the backend admin panel.
If you are on a multi-channel platform first select the channel that you want to view and then look under Channel Settings for the Analytics tab.
Time Period
Start by selecting a preset period or custom date range.
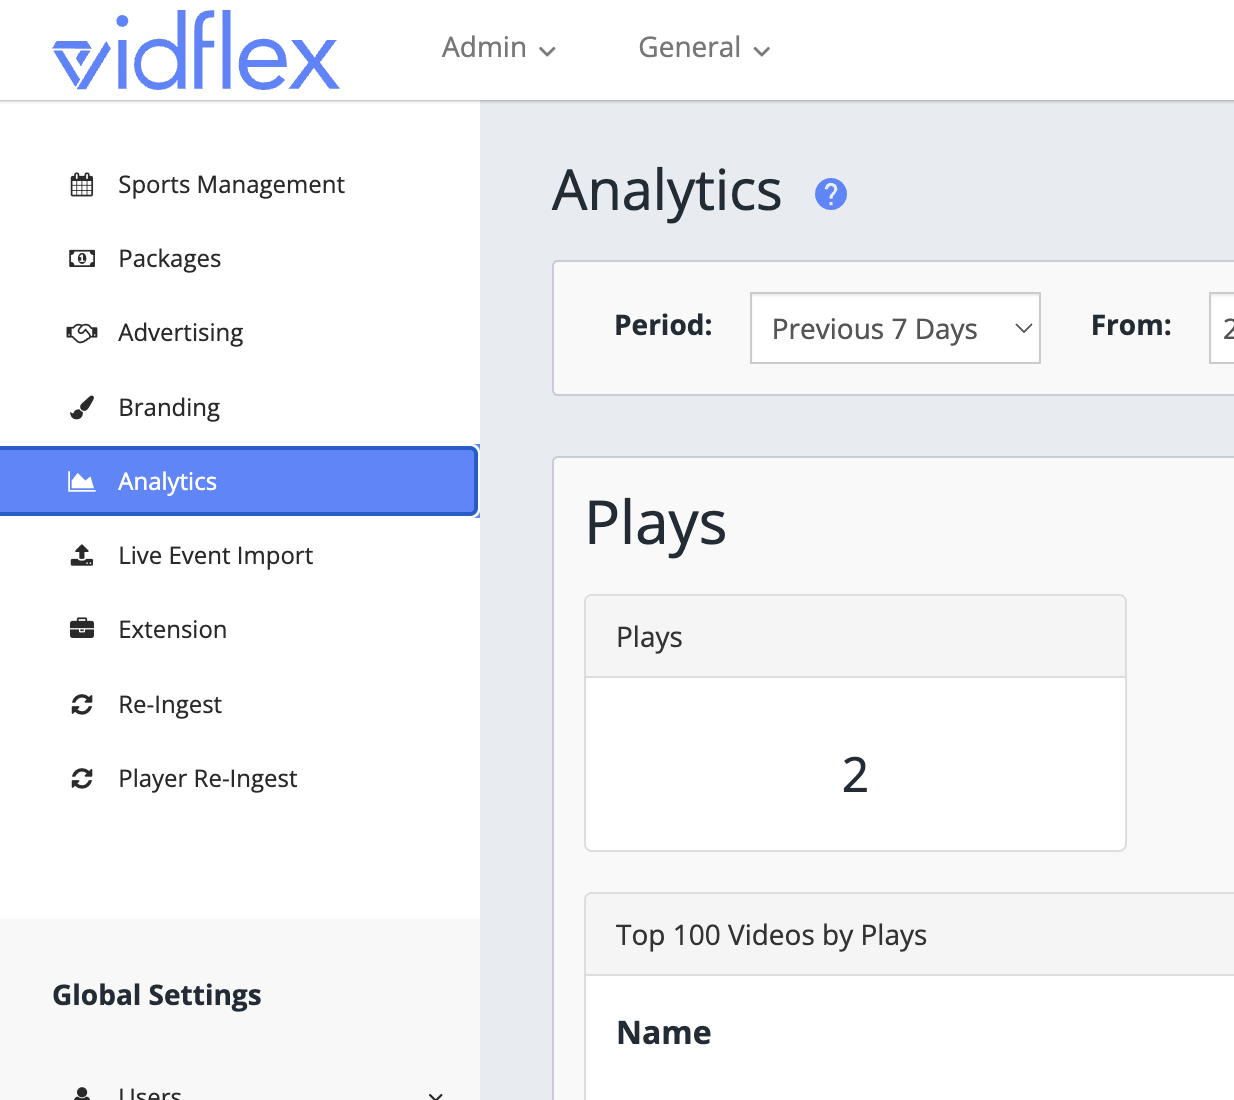
In the Analytics page by default, you will be presented with data aggregated from the previous 7 days. If you want to see the number of plays from a different time period, you can choose one of the following under
Period:
- Custom
- Yesterday
- Previous 7 Days
- Previous 30 Days
Previous Month


If you choose the custom option, then click the start date and end date fields to select the desired dates in the calendar that appears.
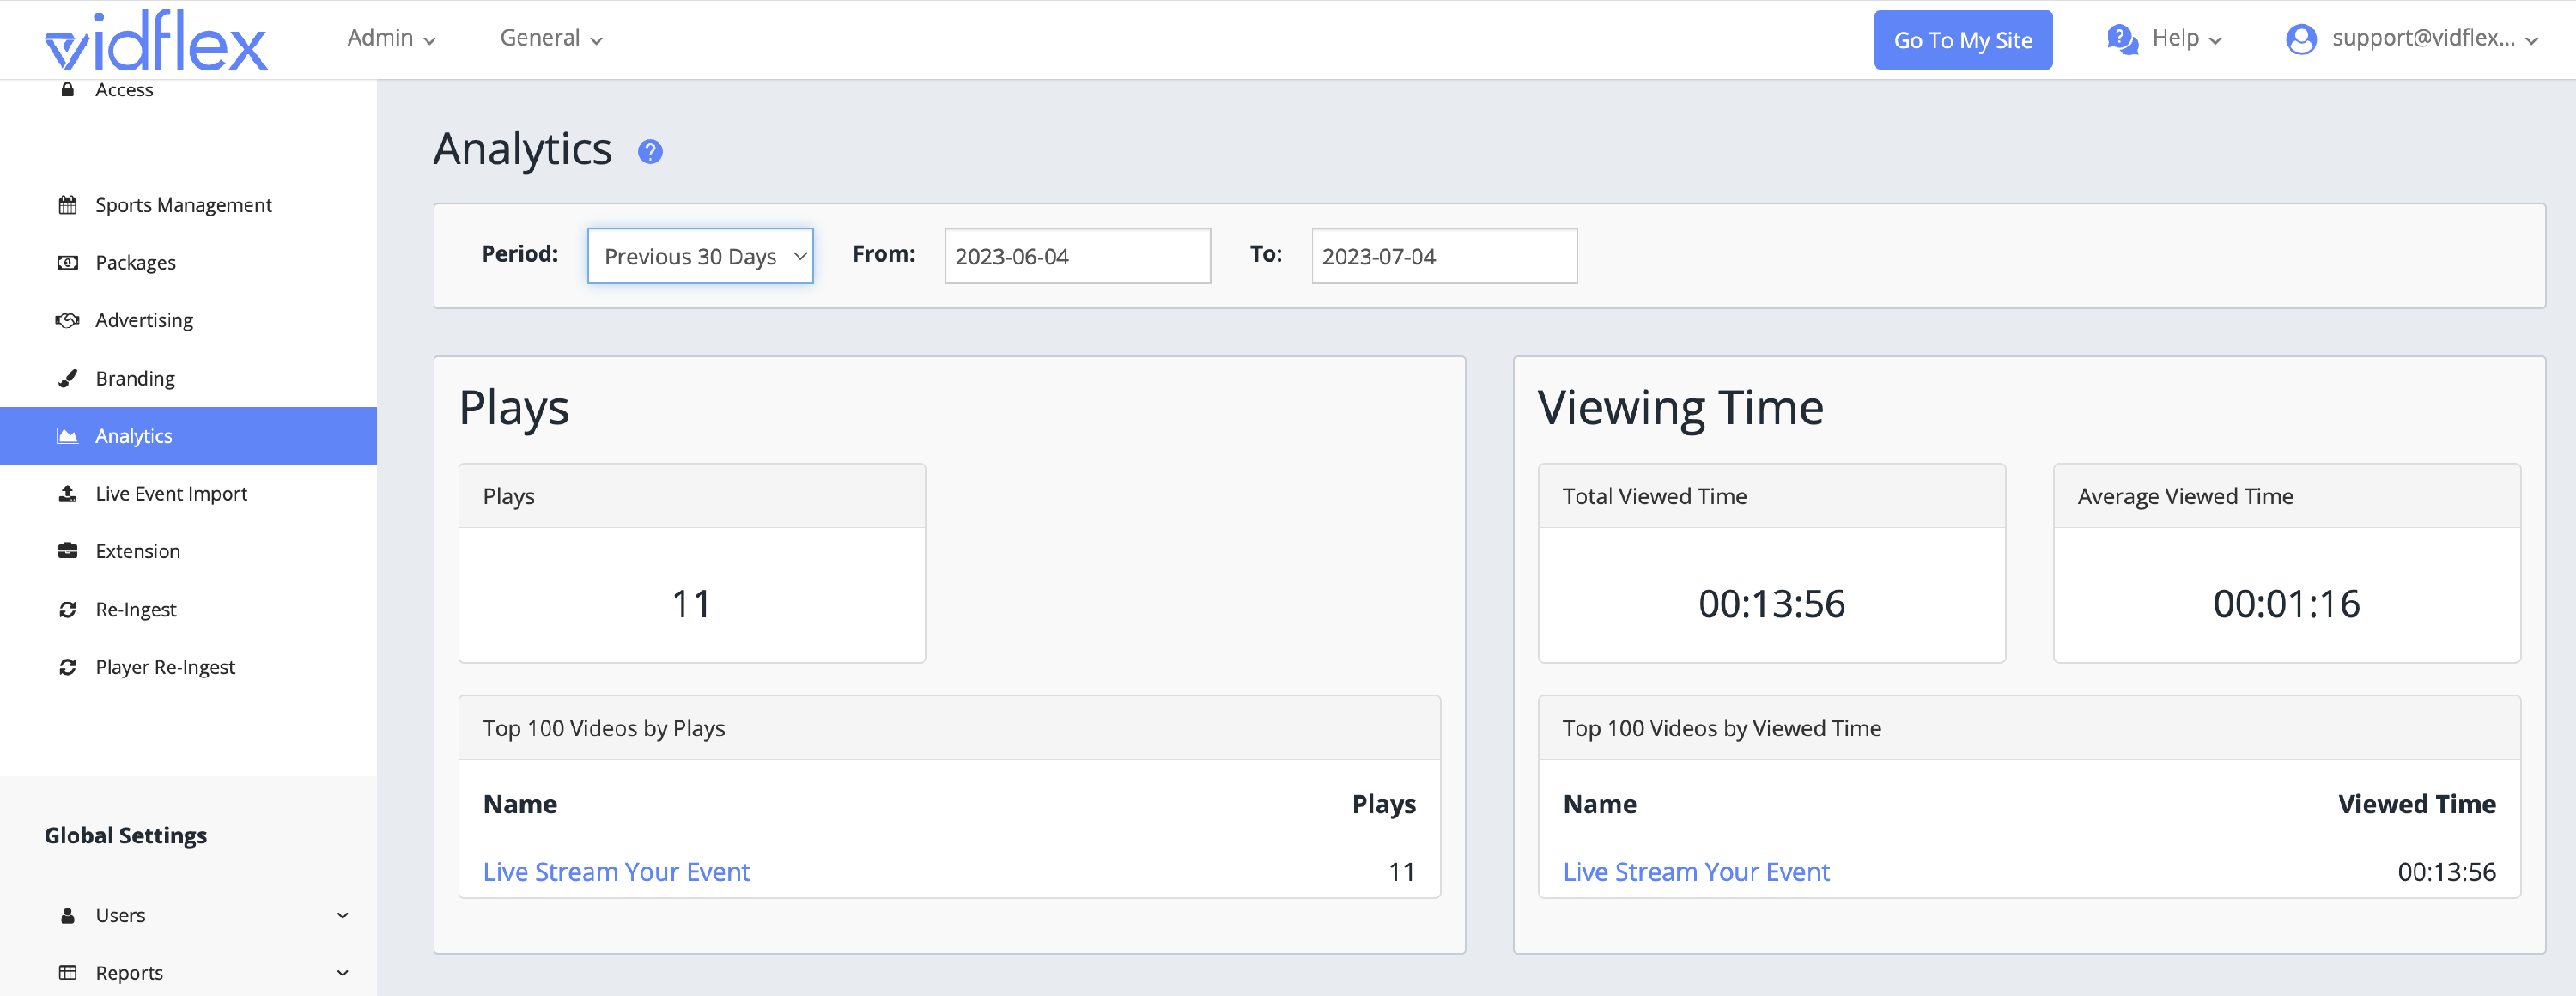
Any other preset date selected will automatically update the From and To fields.
Understanding the Infographics
After selecting a time frame, the Analytics information will display the data collected within that time period in the categories as explained below.
Plays
This section displays the number of times the play button has been clicked each time someone goes to watch a video. The data aggregated here is the total number of plays of all videos on the selected channel.
Total Time Viewed
This section displays the total amount of time spent by a viewer on all videos in the selected channel.
- Time format is in HH:MM:SS
Average Viewed Time
The data shown in this box is the average of the time spent by a viewer on videos throughout the selected channel.
- Time format is in hours, minutes, seconds (00:00:00).
Plays | Viewed Time
A filtered list by most plays or most viewed time is provided at the bottom of the screen to see the data per video from your library. You can also see more detailed information on that video by clicking on it, which will direct you to its container Analytics page.
VOD Analytics
To get analytics on a particular VOD container, first, choose a VOD in your library that you want to Edit, and then select its Analytics tab.

- Data shown in VOD Analytics is identical as shown in the channel analytics, Except VOD analytics provides additional data on the percentage of video watched.
- It provides a breakdown of the number of plays on its video and up to what portion of the video was actually watched.
For example, in the screenshot below we have a total of 5 plays.
In the “Plays - Percent Watched” box you can see how many out of those 5 plays actually made it all the way through to the end of the video, which was none of them.
- 3 plays watched 25% or less
- 1 play made it between 25%-49%
- 1 play made it to 50%-74%

Watch the video below to learn more about VOD Analytics.
Live Event Analytics
The Analytics tab becomes available after the stream has been activated for the first time.
Watch our video tutorial called “Library and Live Event Overview” on how to do this.
- To get to the analytics on a particular Live Event container, choose a Live Event in your library that you want to Edit and then select its Analytics tab.
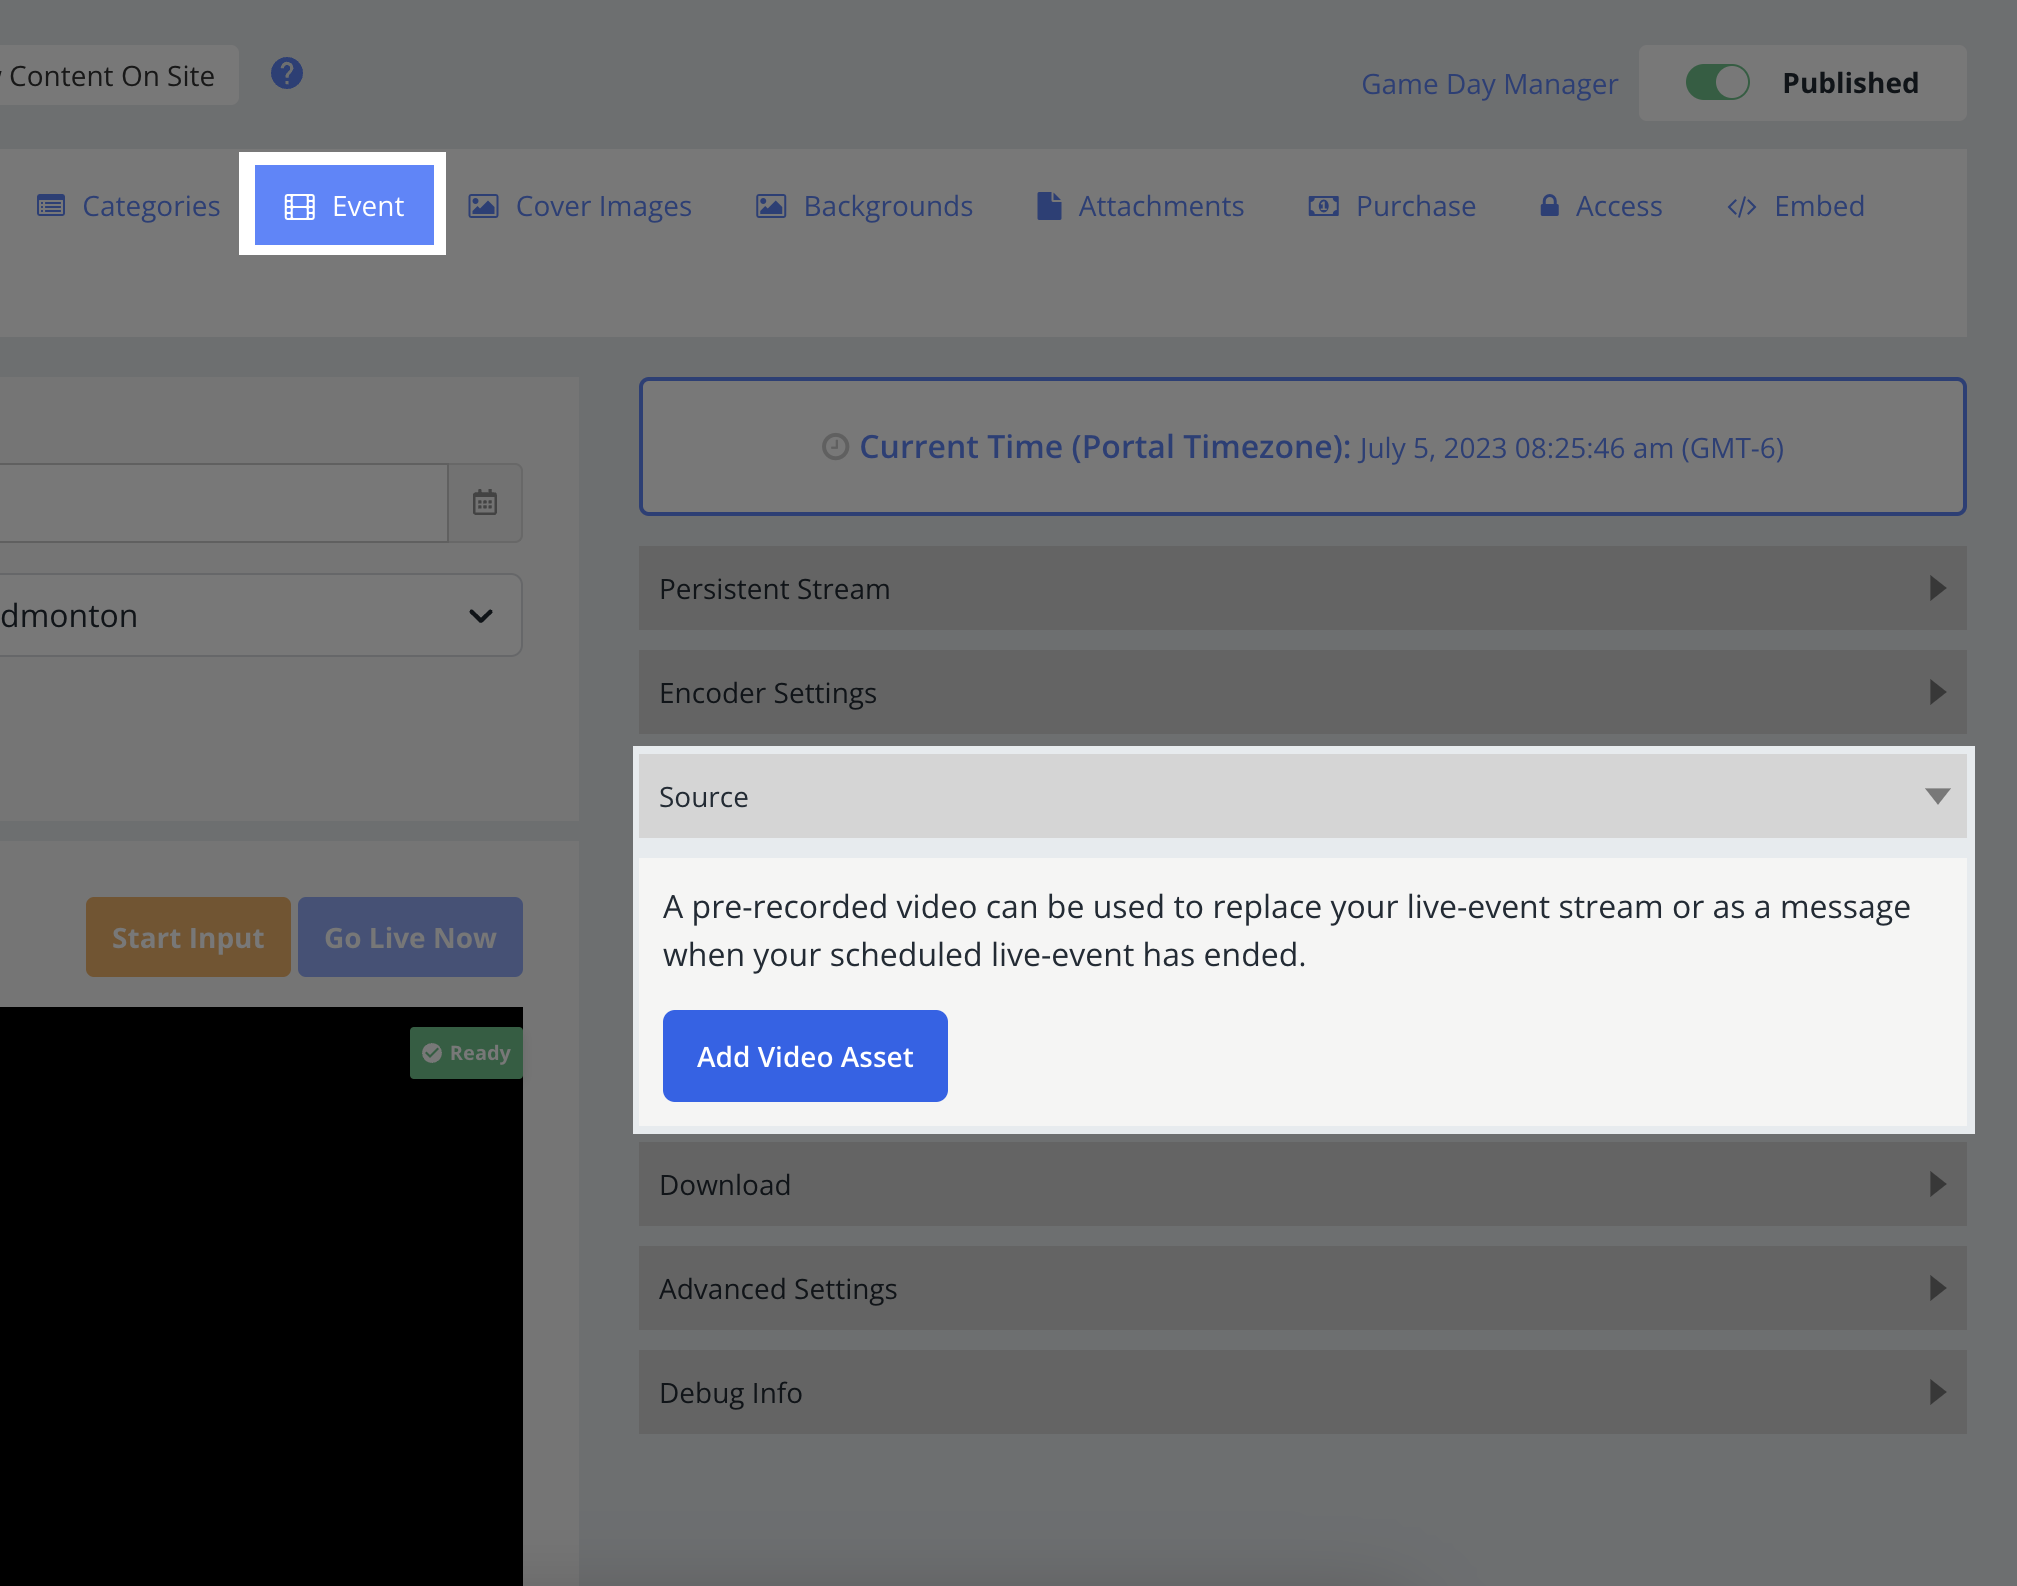
The Live Event containers Active Video Source determines the analytics shown on its Analytics page. This is selected under the container’s Event tab > Source.

General Notes
- By default, the active video source will use the Live event stream. If you have an uploaded video asset and want to see its analytics then you can select it as the active source.
- There will be no analytical data if it's the first time choosing the uploaded video as the source.
- If the active video source is a video asset then the “Plays-Percent Watched” info (same as a VOD container), will be enabled automatically providing that video is 1 minute or longer.
- If the active video source is on the Live event stream then the “Plays-Percent Watched” section will not be displayed. This is due to the uncertainty of ending times of the Live-streamed video.
Watch the video below to learn more about Live Event Analytics.
Advertising Analytics
To get the stats on advertising, also known as Pre-Roll videos, select the Advertising tab on the left-hand side under the channel settings, and click on the blue graph icon under the stats.


Plays
The data shown under this box is the number of times the advertisement was played at the beginning of the video. It is shown in both numerical form which displays the total number of plays and the other is the graphical representation breaking it down by the day.
Impressions
This display box gives you the data on the number of impressions registered on all the pre-roll videos combined, under the selected campaign. Impressions are registered when the advertisements were watched till the impressions mark is set and will not register if the video was skipped in between.
Clicks
The data shown here is the number of times viewers clicked on the LEARN MORE button shown during the advertisement.
Click Through Ratio
This information shows the number of clicks per impressions. For example, if there were 5 clicks out of 100 impressions, then your click through ratio would be 5%.